Every Breathe You Take
By
Vikas Kumar and Yazhini Rajesh
Trends in Project 2
AQI and POLLUTANTS PARAMETERS
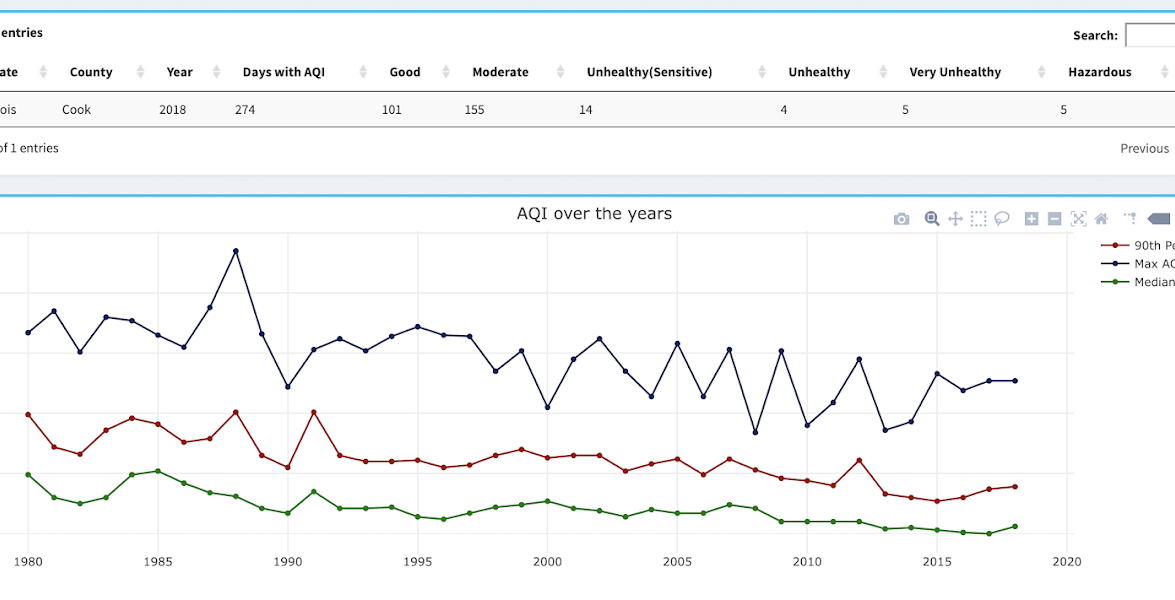
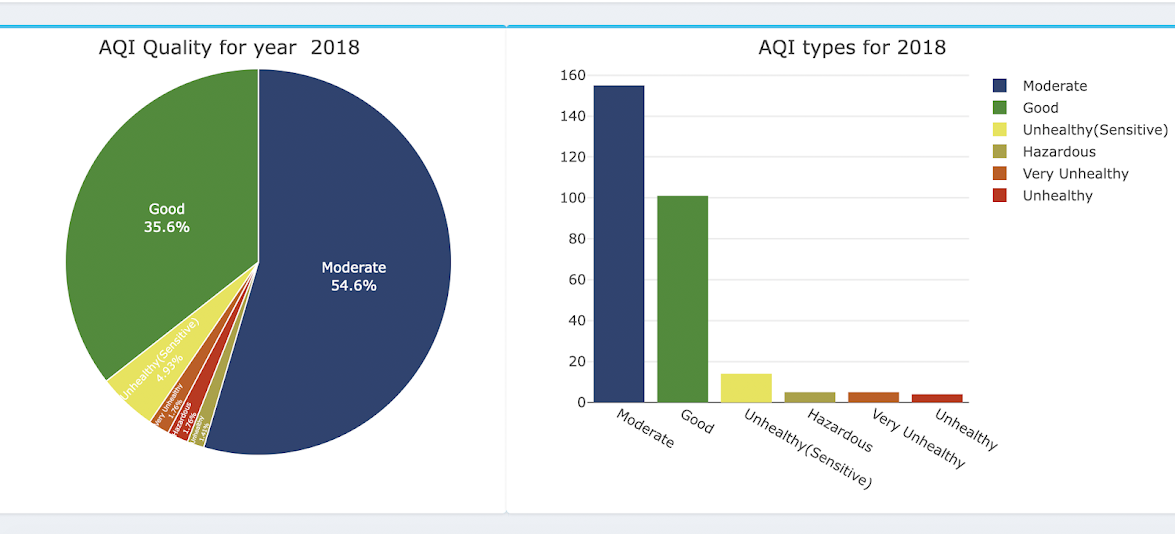
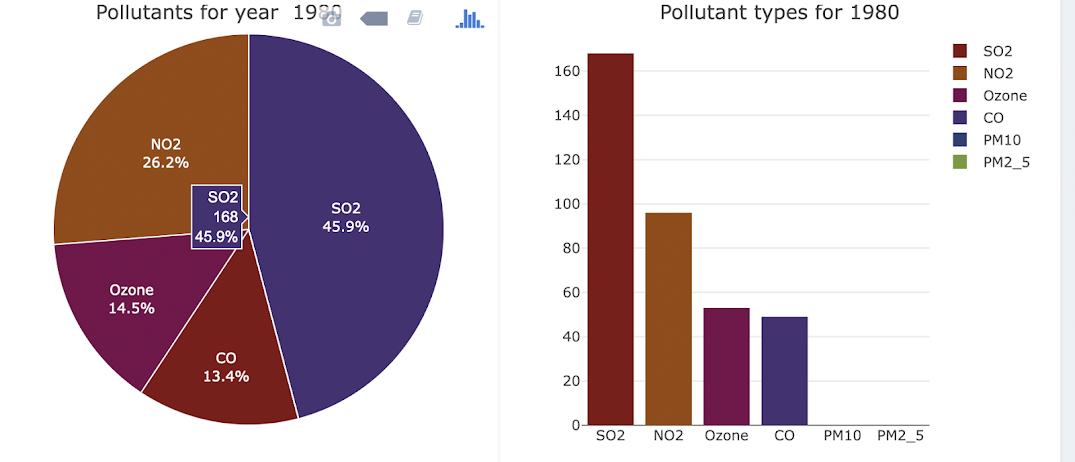
IN COOK COUNTY: AQI has improved from 1980 to 2018. Though in the middle there was a spike in 1988, comparing 1980 and 2018 we can see that there has been lots of improvements. There were more unhealthy days in 1988 as compared to 2018 but the number of moderate days remain the highest.
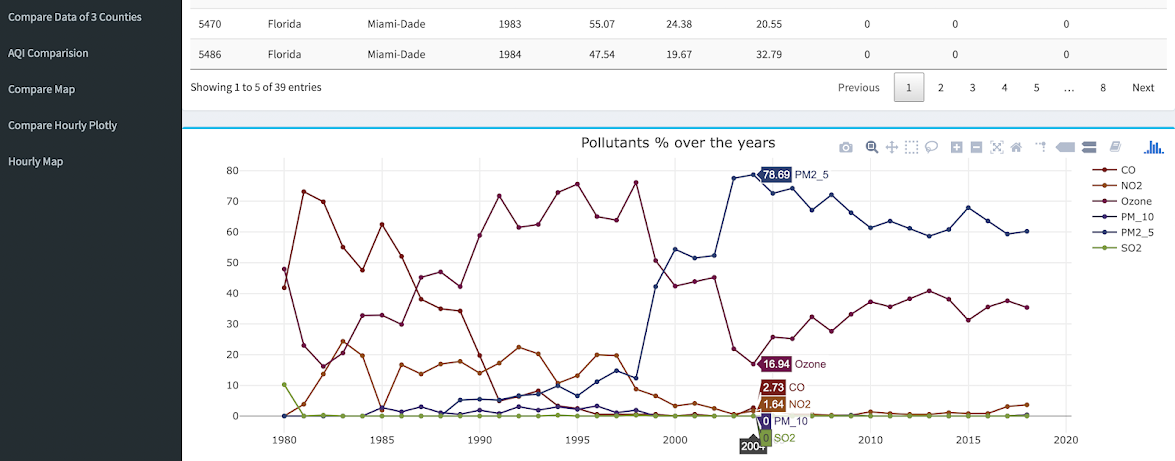
IN ANOTHER COUNTY (Miami, Florida)
Here it gets quite interesting. In Miami, the pollutant levels have drastically changed. Till 1986, CO has the maximum level. From 1987 to 1998, Ozone has had the maximum level. However, since 1999, PM 2.5 has been on the rise. The reason could be that the salt in the air has increased or industrial activity has increased in Miami. However, AQI has decreased drastically here.
AQI and POLLUTANTS DAILY TRENDS
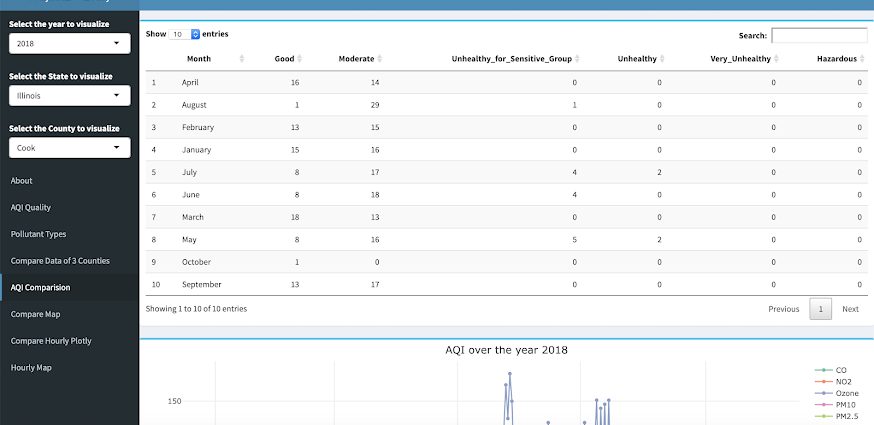
IN COOK COUNTY: Looking at the year 2018, we can see month-wise data. We find out that months May, June and July have the maximum number of unhealthy days. This could be that there has been an increase in pollination or due to increased pollution as it is summer and more people are prone to travel outside that too with increased consumption of Air Conditioner. August has the maximum number of moderate days.
Pollutant-wise, we can see, Ozone is at the maximum on May 27th which can explain why May has the maximum number of unhealthy days. On March 3rd, NO2 is at it's maximum and PM10 is at the maximum in May again.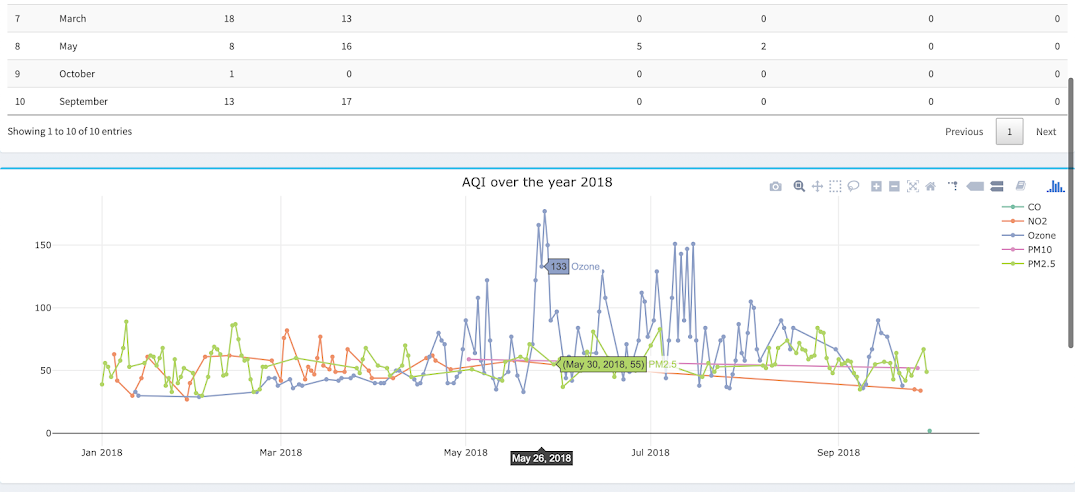
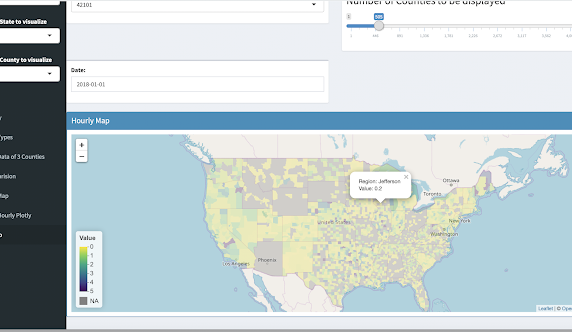
DAILY INFO ACCORDING TO MAP
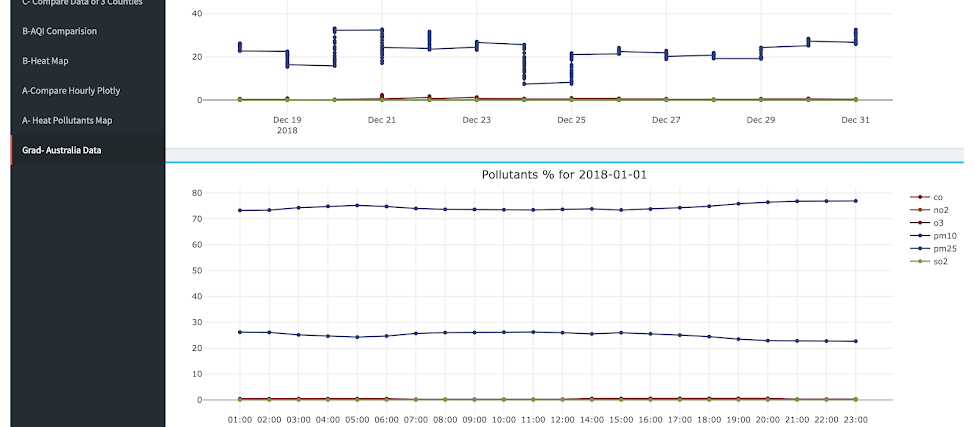
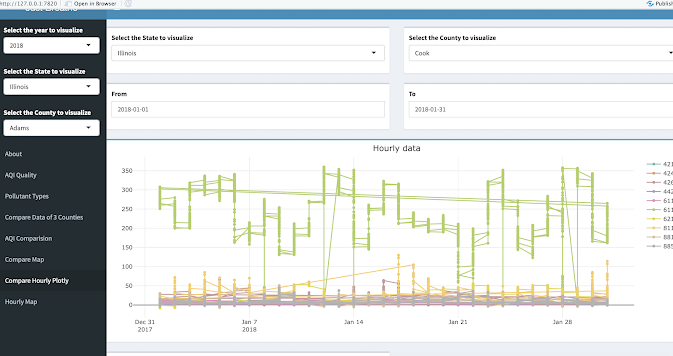
From 01-01-2018 to 01-31-2018, PM2.5(61104) has been at the maximum and SO2(44201) has been at its minimum. Looking at he hourly fluctuations we can see that there isn't much spikes in any of the pollutants except PM 2.5 which increased at 5:00 PM on 01-01-2018. This could be due to increase traffic being New Year and everyone is trying to find their way back to normal life.
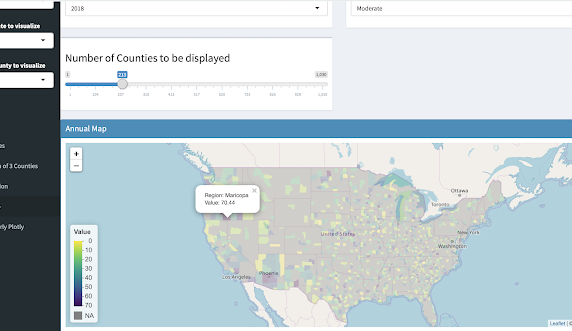
MAPS- POLLUTANT HEAT MAP (OVER 2018 AND HOURLY)
GRADUATE STUDENTS
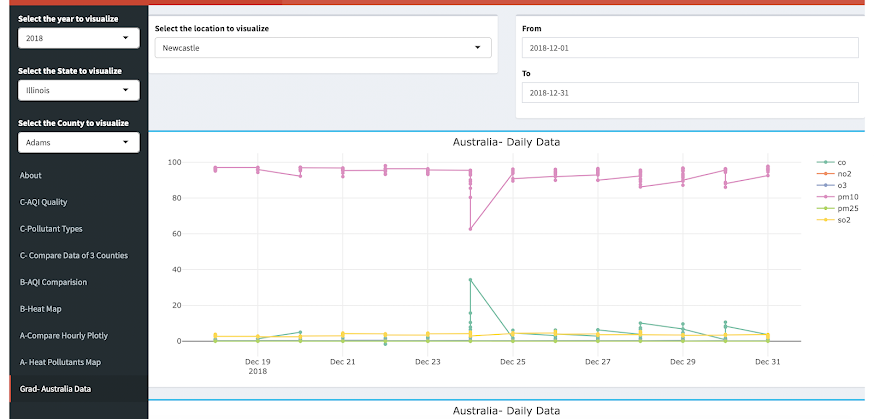
For the last part of Project 2 we have taken up India and picked Australia to find out the hourly and daily trends in. We can see that in Australia, PM 10 is the maximum pollutant especially in Auckland Point where it is at maximum. CO is prominent in Newcastle as well. In Wollonlong, PM 10 was prominent that usual during December 24- December 25 which can be explained because of the festive season.