evlWeatherForR
Home
evlWeatherForR
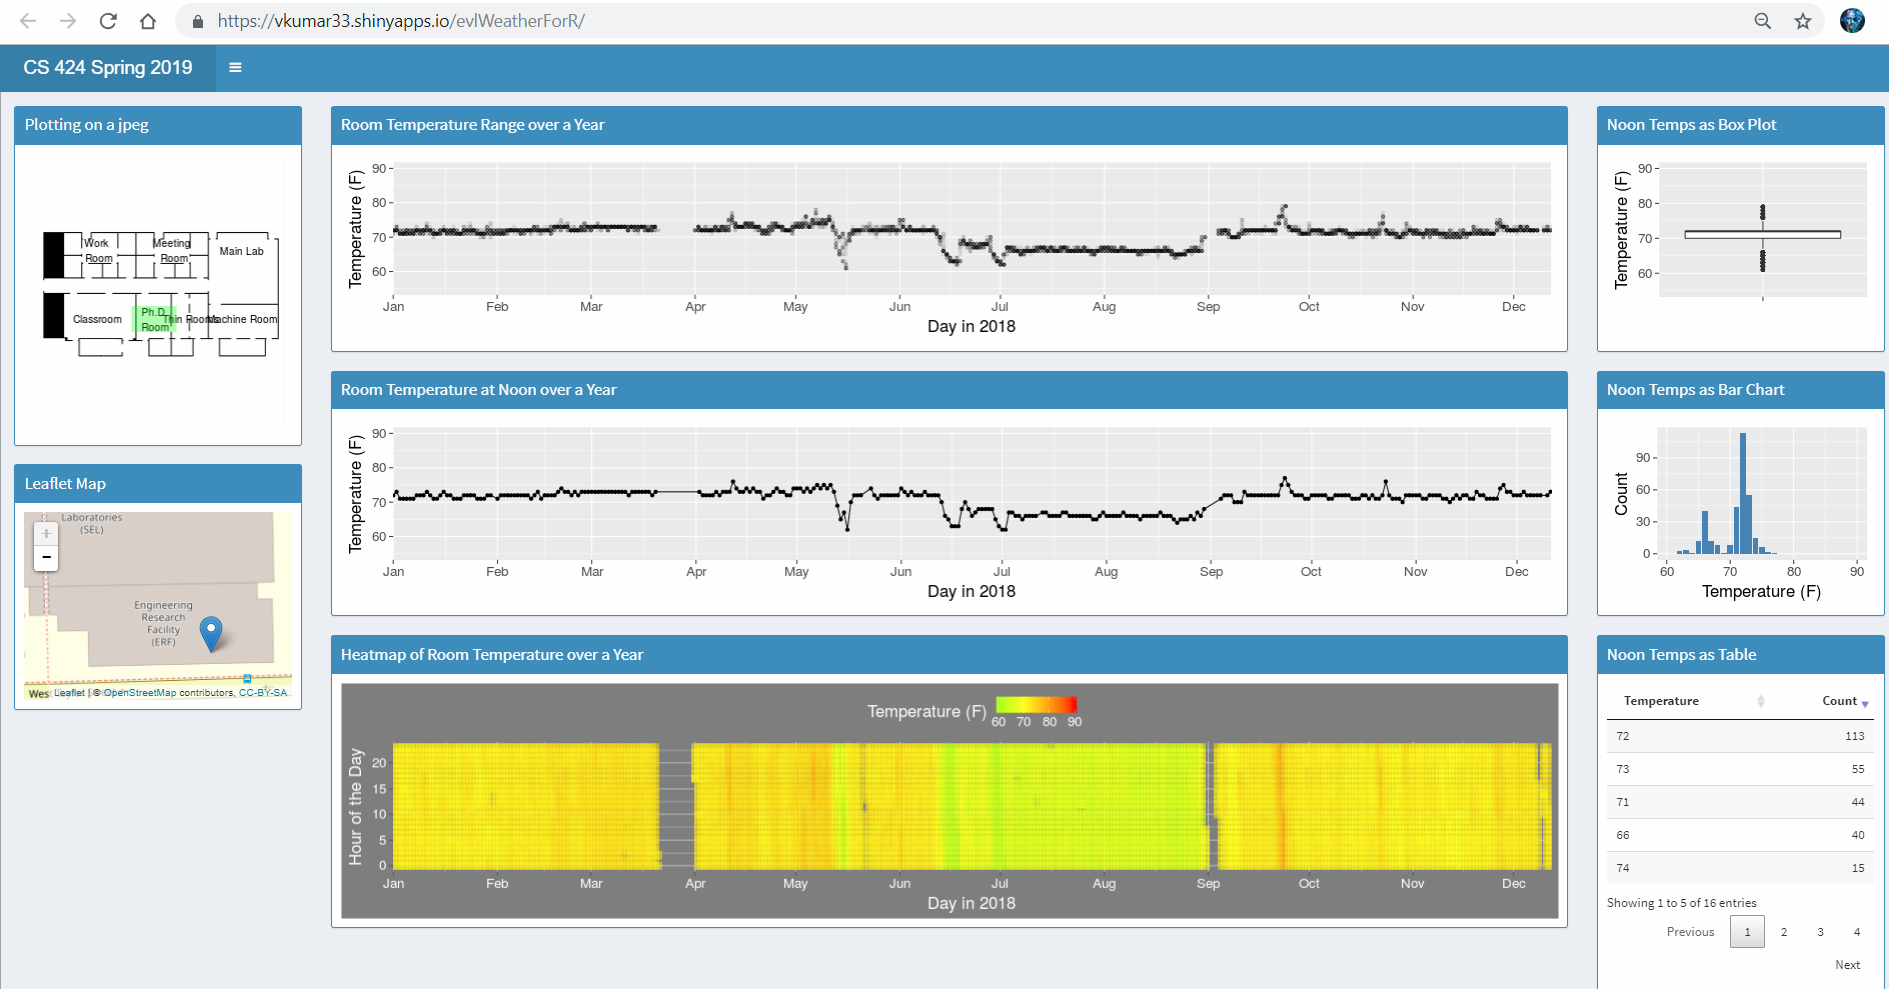
In this project we use R and shiny to visualize the temperature of various rooms and figure out why the temperature changes so dramatically at times.
The data consists of temperature of 7 different rooms over the past 14 years. We use different types of visualization graphs like histogram, boxplot, heatmap and line chart in order to visualize the data.
We used shiny package as it makes it very easy to build interactive web apps straight from R.
Reference code for this project was provided by Prof Andy Johnson.
Link to Visualization in Shiny